“The key to growth is the introduction of higher dimensions of consciousness into our awareness.” — Lao Tzu
This is the second in a series of articles introducing my GTO Holy Grail Algorithms. These articles are based on my newest book, Lectures on Poker, Volume 1: Small Stack Tournament Strategy.

GTO Open Shoving
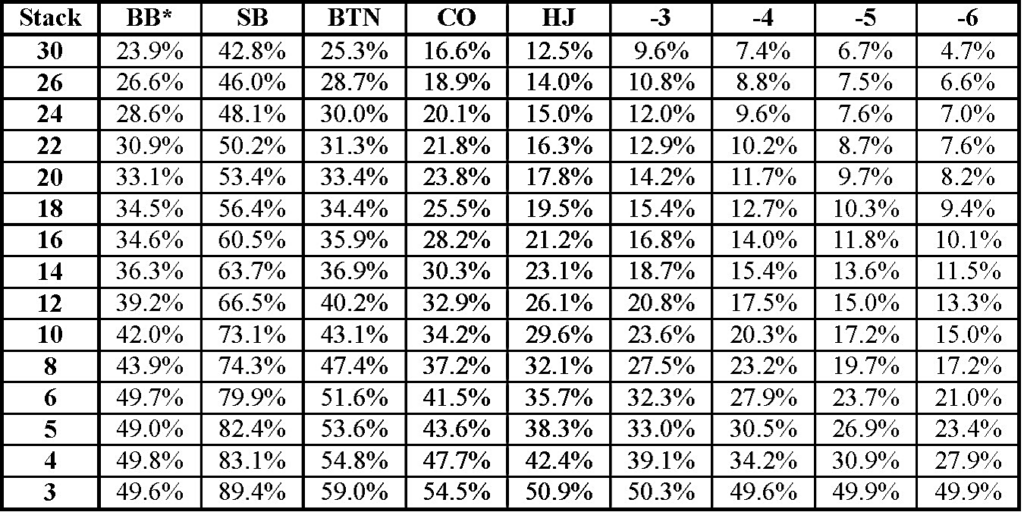
We finished Part 1 by developing the GTO open-shoving chart shown again in Figure 1. We can see that our GTO shoving range gets wider as the effective stacks get smaller and as our position improves. This is precisely what we should expect.

This chart provides a good start for knowing which hands we can unexploitably shove with a short stack. But we need more than a shoving range percentage; we need to know which specific hands to shove. Yet memorizing the precise combos belonging to each range would be a formidable task for most of us.
We need a way to simplify this undertaking.
The Combo Power Index (CPI)
We begin by establishing a Combo Power Index for each starting combo. This is similar to the SAGE Power Index introduced by Lee Jones and California math professor James Kittock in 2006. The CPI assigns points to our starting hand in a manner that corresponds to its GTO open-shoving strength. I will start by introducing the CPI algorithm, and then explain how I determined its parameters.
Determining the CPI Algorithm
- We assign a Power Number (PN) to each hole card; ace (17), king (13), queen (12), jack (11), 10 (10), and so forth. This is simply a card’s rank, except for the ace.
- We double the PN of our top card and add it to the PN of our bottom card; for example, T3o is 23 points (2×10+3).
- Finally, we add more points depending on the “type” of combo:
- Paired = 36 points
- Suited = 5 points
- Connected = 5 points
- 1, 2 or 3 gapper = 3 points
The sum of all these points is the CPI. This algorithm is more complex than the original SAGE Power Index, but it more accurately represents the GTO jamming strength in full ring situations with effective stacks of up to 30 big blinds.
The method I used to establish the CPI parameters is straightforward. First, I tabulated the EV for all of the combos in a particular situation, such as the Figure 2 solution for a 16 BB open-shove from the button. This plots the EV for combos with a CPI between 31 and 46 points, which is the range of highest interest in most situations. Then I simply adjusted the CPI parameters to maximize the “goodness of fit” (R2).

Lastly, I made small adjustments to make the algorithm easier to use at a live table. I could have created a slightly more accurate CPI by using fractional parameters or different point values for 1, 2, and 3-gappers, but that would be more difficult to use. This algorithm is an excellent compromise. Consider some examples:
- TT: 20 (double the top card) + 10 (bottom card) + 36 (pair) = 66 points.
- JTs: 22 (double the top card) + 10 (bottom card) + 5 (connected) + 5 (suited) = 42 points.
- QJo: 24 (double the top card) + 11 (bottom card) + 3 (gapped) = 38 points. Be careful, QJo is a gapper, not a connector.
- 32o: 6 (double the top card) + 2 (bottom card) + 3 (gapped) = 11 points. This is the worst combo in the CPI system.
- The median CPI is 30 points; 50% of all combos have a higher CPI.
Don’t worry about remembering the CPI algorithm. Thirty minutes of practice will etch it into your memory. (Caveat: This CPI definition is not the same as SAGE, nor is it the one from Tournament Poker for the Rest of Us.)
The Ranking of Hands
The quality of our starting hand and our effective stack size are the primary influences in our GTO jamming strategy. Although there are other factors that can influence our decision, our GTO jamming range is the baseline from which we should adjust our play.
A hand ranking based on the EV for open-shoving a 16 BB stack from the button isn’t definitive for other situations. And this ranking will not match those built into programs such as Flopzilla. Fortunately, we don’t need a theoretical hand ranking scheme for our purposes here.
We have the Combo Power Index for each starting hand, and we know the GTO open shoving rank associated with it. When we plot the CPI of each combo against its accumulative range, we find the curve shown in Figure 3. (Accumulative range is the range of all combos with that CPI and higher.)

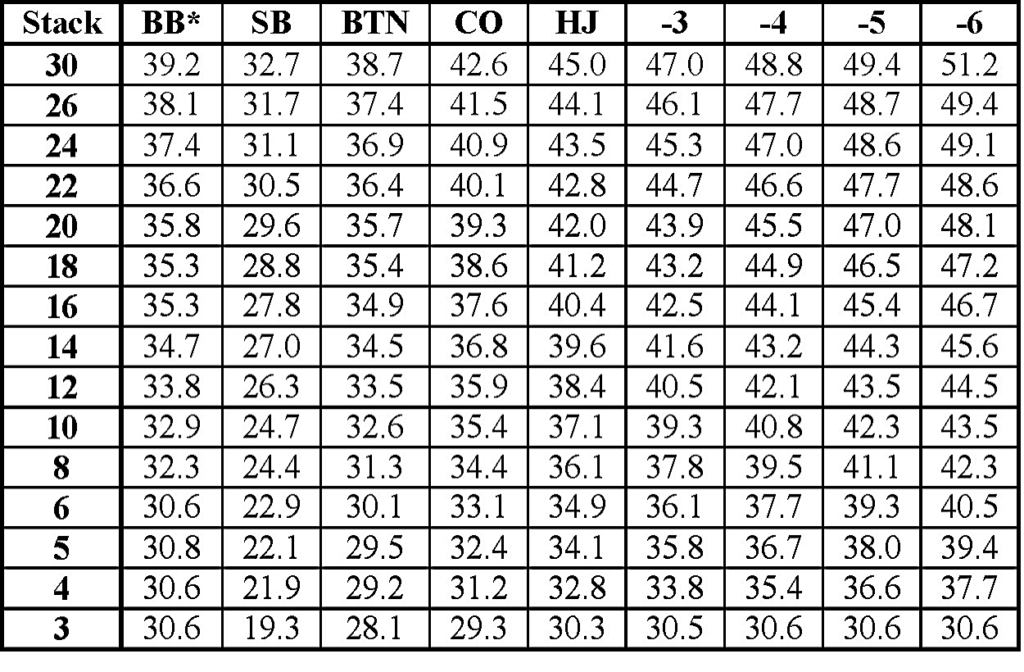
We then fit this data with a 6th order polynomial and use that equation to convert the percentage ranges in Figure 1 into Open-Shoving indexes. The result is summarized in Figure 4. Notice that the goodness-of fit (R2) is nearly 1, so the error associated with individual combos is very small, usually less than 1 index point.

Example
Suppose we’re in a live tourney on the button with a 12 BB effective stack. Before the next hand is dealt, we check our chart and see that our Open-Shoving Index is 33.5 points. The cards are then dealt and we find QTo. The action is folded around to us. Do we have a GTO open-shoving hand?
The CPI for QTo is 37 points (2×12+10+3), which is higher than the Open-Shoving Index of 33.5 points. So we do have an unexploitable GTO shoving hand.
Let’s consider what’s happening here. With the BBA, there are 2.5 BBs in the pot with 12 BBs effective. Let’s suppose that both blinds have 15 BBs. Our Shoving Index of 33 represents a 40.2% GTO shoving range, from Figure 1.
The GTO call-shove range happens to be 26% for the small blind, which means he should fold 74% of the time. The GTO call-shove range is 31% for the big blind, so he should fold 69% of the time. Therefore, if both blinds are playing GTO calling ranges, our expected fold equity is about 0.76×0.69 = 52%. And we will have reasonable equity when called by their GTO ranges.
Few opponents will call with such wide ranges because their chips are precious to them. This is especially true when losing would eliminate or cripple them. If each opponent called with much tighter (e.g., 10%) ranges, we would win the pot outright about 81% of the time.
Since nearly all opponents call too tightly, we can exploit them by shoving even wider than our GTO chart recommends. This means we can consider our Open-Shoving Index to represent the “tight limit” of our open-shoving range. This is one reason why our chart doesn’t need to be perfectly accurate. We need not be concerned about small errors here.
Summary
Now we have a system that we can easily use at the table. We simply make a copy of Figure 4, perhaps putting it into our smartphone. Then we find our Open-Shove Index before our cards are dealt. Once we see our hand, we calculate its CPI to determine whether it is within the GTO Open-Shove range.
This becomes our baseline strategy. If we have a GTO-shoving hand, we can open-shove, open-bet or fold, depending on our particular poker landscape. If not, we can confidently fold. Our near-perfect GTO knowledge provides tremendous confidence in our decision-making.
The next installment in this series will show how we can simplify this system even further so we don’t need to look at a copy of our chart. This is the Holy Grail Shoving Algorithm.


