Poker players often describe the word “variance” as something like “I got screwed by that river card.” To them, it only means a change in their luck, usually for the worse. But variance has a mathematical description with two main causes: 1) the poker gods, and 2) our playing style.
Much of what follows is excerpted from my Chapter 4 of my book Tournament Poker for the Rest of Us. My goal here is to explain cash game variance so that you will better understand the impact variance has on tournament poker strategy, the subject of my next article
The Poker Gods Are Ruthless
The poker gods are all mathematicians. No matter who we are, they gift us pocket aces every 221 hands (on average), precisely 0.4525% of the time. When we flop a flush draw; they will complete our flush on the turn 19.149% of the time. Over the long run, our actual results get closer and closer to the poker god’s statistical law.
“If there weren’t luck involved, I would win every time.”
– Phil Hellmuth
The basic point here is that no one is significantly luckier than anyone else “in the long run”. Although mathematical variance can significantly impact our short-term results, they approach their natural level in the long term.
Mr. Liberty’s Bell Curve
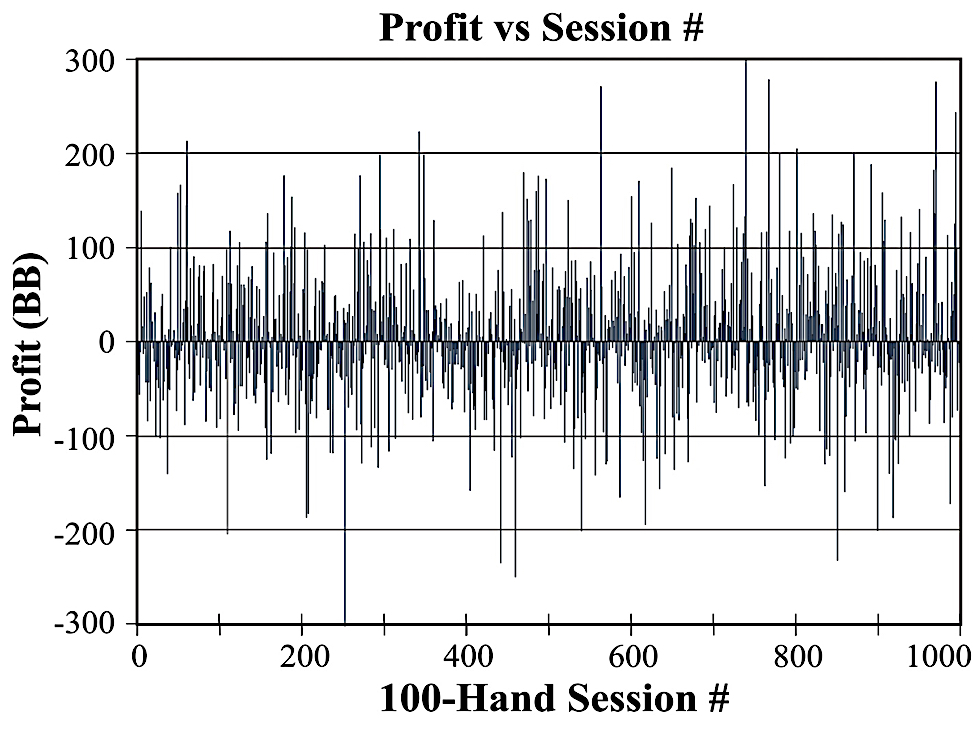
Mr. Liberty is an online cash game player with a large PokerTracker database. Consider the profit for each of his 100-hand “sessions”, shown in Figure 1. We can see that his average session profit is very small compared to the swings he experiences from session to session; his mean profit was 4.22 BB/100 and his standard deviation was 71 BB per session (71 BB/100).
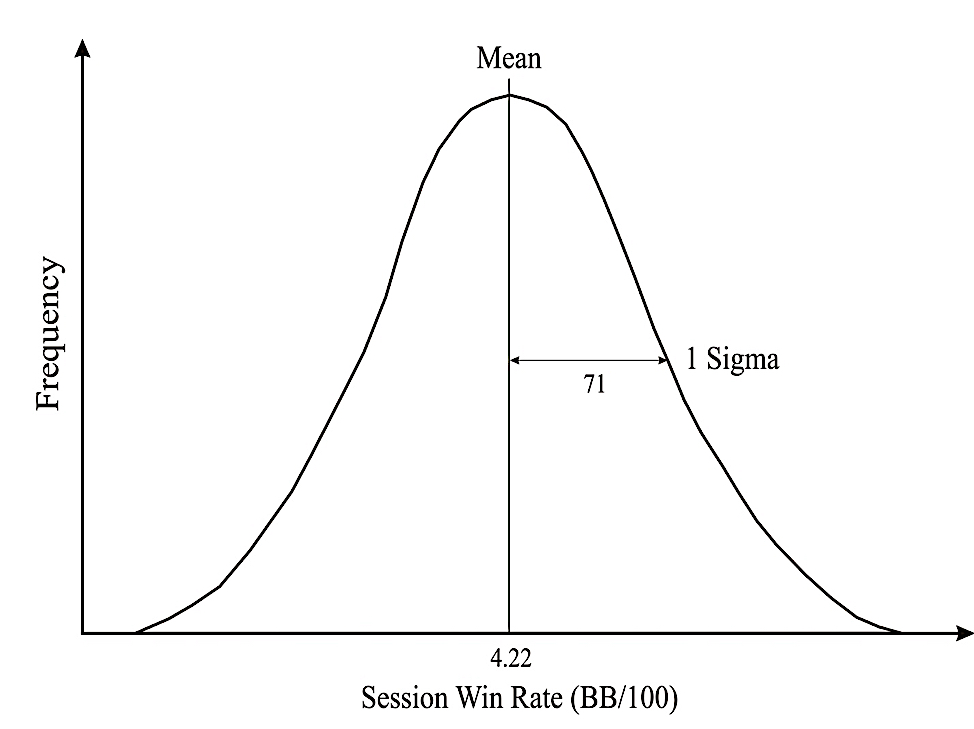
Figure 2 expresses this data differently, by plotting how often Mr. Liberty wins each amount. His performance follows the classic “bell curve” distribution; mathematicians call it a Gaussian or a normal distribution. We find that his average win rate was 4.22 BB/100, with a standard deviation (1 sigma) of 71 BB/100. A ± one sigma variation from the mean includes 68% of the entire population.
But there is additional useful information in this dataset.
Figure 3 shows HERO1’s cumulative profit over 1,000 sessions. He has an overall profit of 4,219 BB, or 4.219 BB/100. His actual net profit at any point can be compared to his expected profit at that point (dashed line), which produces a new dataset. From this we can calculate the standard deviation of his time-dependent profit, which is 2.22 BB/100.
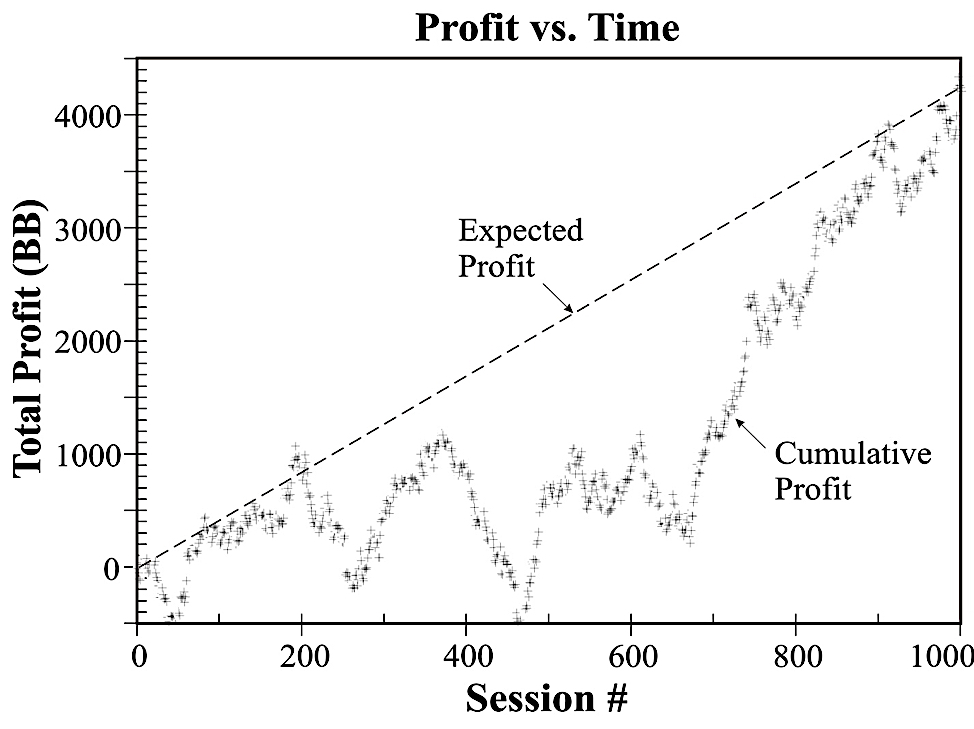
So Mr. Liberty’s long term win rate was 4.2 ± 2.2 BB/100 over this 100,000 hand sample. His time-dependent sigma of 2.2 BB/100 tells us how confident he can be that his win rate is not a fluke. In his case, there is a 68% chance that his true quality is between 2.0 and 6.4 BB/100. And the longer he plays, the lower this sigma drops and the more confident he can be.
Playing Style Affects Variance
Without getting mired in the details, the standard deviation of our distribution is just the square root of the mathematical variance. So we can study our poker variance by analyzing the PokerTracker StdDev(BB/100) statistic from my online database, which includes 121,000 players. The average database value was 71 BB/100, but it’s only 60 BB/100 for the 2,000 players with the most experience (the Veterans). These players are more skillful than the average player, so we might conclude that better players have a lower variance. But is this true?
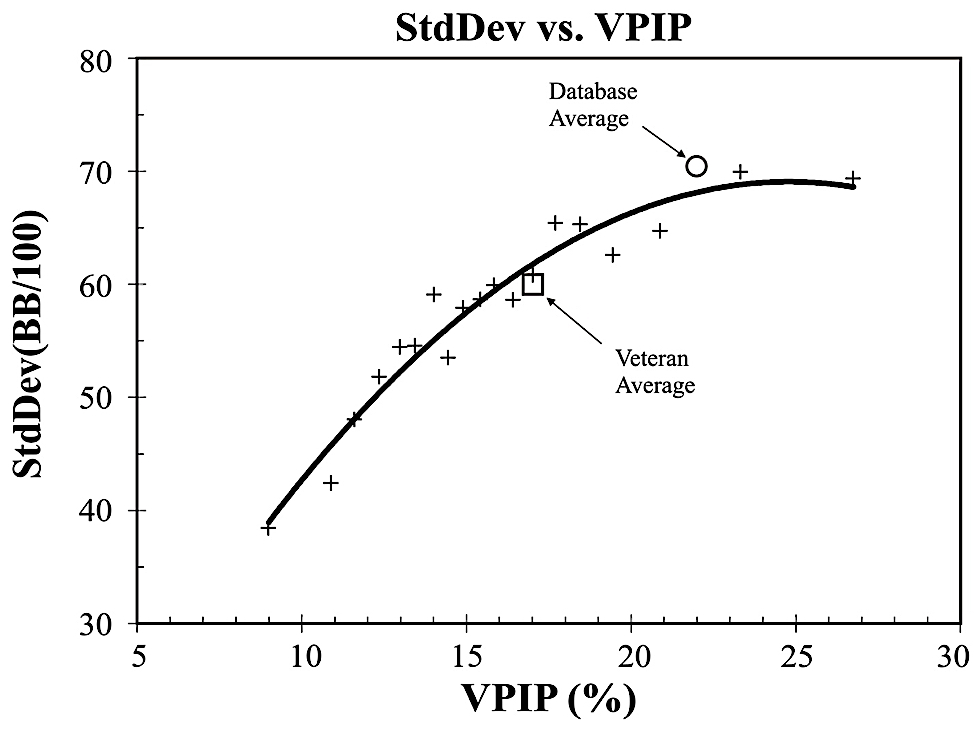
Figure 4 plots StdDev versus VPIP for the Veterans. VPIP is the percentage of hands that a player chooses to fund, which is a measure of a player’s looseness. Clearly:
Loose players exhibit higher variance than tight players
Indeed, the loosest Veterans exhibit a variance about 80% higher than the tightest Veterans. And since the average Veteran has a significantly lower average VPIP% (17.0%) than the average database player (22.1%), we should expect him to have lower variance as well.
We can also explore the relationship between variance and preflop aggression, where we find that:
Aggressive players exhibit higher variance than passive players
We can study many other poker stats, such as preflop 3Betting, flop CBetting, floating and bet sizing. But the principle is the same:
The more chances we take, the higher our variance will be
Skill Does Not Determine Variance
Figure 4 does not tell us whether better players have low variance. Better players tend to be tighter than average, but also more aggressive. Yet they are neither the tightest nor most aggressive players.
However, the best online players do tend to have the highest preflop Aggression Ratios (PFR%/VPIP%). When they play a hand, they nearly always raise rather than limp. So let’s look at variance versus Aggression Ratio, Figure 5.
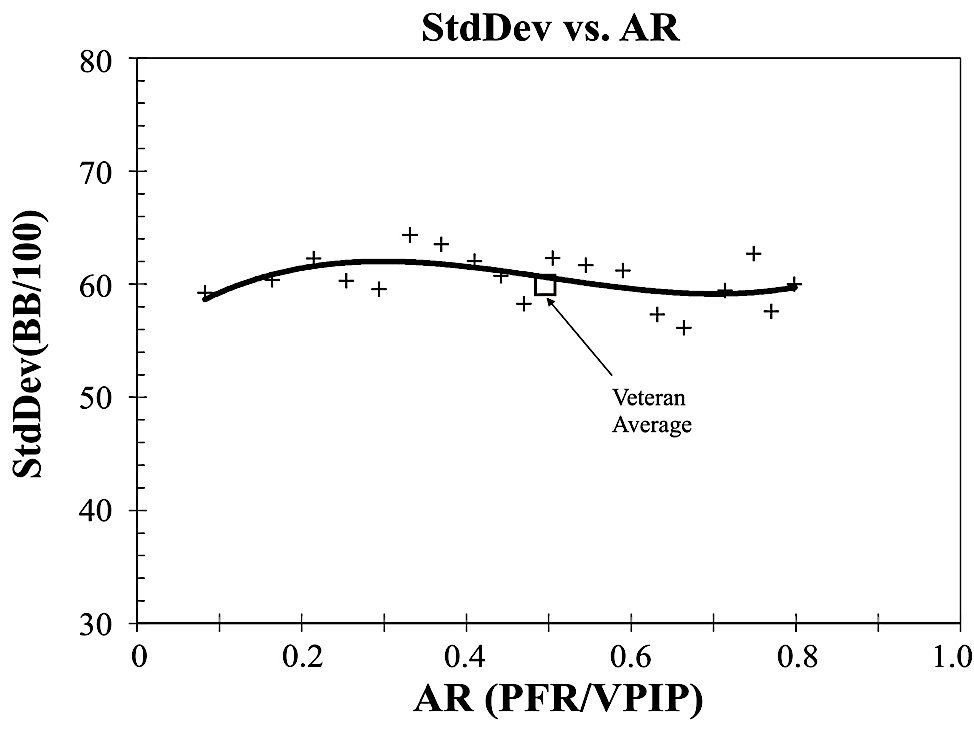
This plot shows no correlation between Aggression Ratio and variance. The weak players at AR = 0.1 hardly ever raise and often limp. The strong players at AR = 0.8 raise nearly every time they enter a pot. Yet, their variance is nearly the same.
Poker skill is not a primary factor in cash game variance
Conclusion
Variance is a key concept for a cash game player to grasp; it’s not healthy to blame our results on bad luck, since the poker gods give everyone the same luck in the long run.
But variance is affected by our playing style. Our “swings” will be much larger if we are very loose and aggressive. These swings can affect our attitude, perhaps putting us on tilt, which can affect our win rate.
Other than tilt, there is no reason for a cash game player to manipulate his variance to be more profitable. This is in stark contrast to tournament variance, which I will discuss in my next article.
Steve Selbrede is the author of six poker strategy books: The Statistics of Poker, Beat the Donks, Donkey Poker Volume 1: Preflop, Donkey Poker Volume 2: Postflop, Donkey Poker Volume 3: Hand Reading and Tournament Poker for the Rest of Us.


