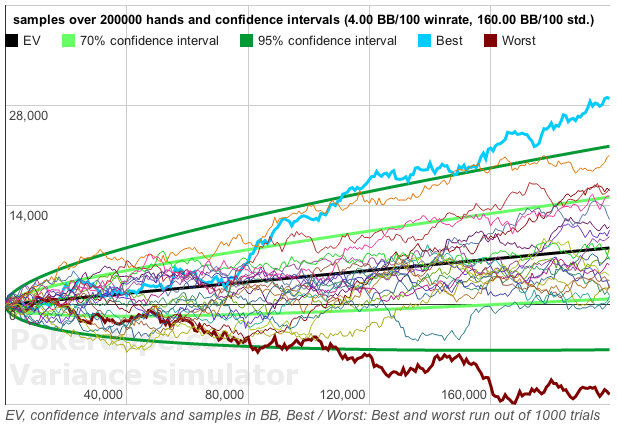
A visual representation of how big the variance is in poker

BelFish

BelFish

Legend
Loyaler
Joined
Aug 11, 2019
Total posts
2,396
Awards
3
BY
Chips
309
I think that most players already know that winnings (or losses) in poker are described by a normal distribution. In the drawings, this is usually depicted as a "bell" of the distribution. Not only poker, but also many other processes, phenomena and characteristics of something in real life are subject to this distribution.


For clarity, we will assume that this picture describes the length of something )))
And for a large number of measurements, this length is on average around the world equal to 14 centimeters with a standard deviation of 2 centimeters (corresponding to a variance of 4 cm^2).

Then deviation within ±sigma will be performed for 68% of measurements, and deviation within ±2sigma will be performed for 95% of measurements. This means that if 100 random measurements are taken, only about 2.5% of the measurements will give a length of less than 10 cm, and about 2.5% will give a length of more than 18 cm.

Here is a picture built for these scales (expected value = 14 and sigma = 2):


Now consider the same for poker at the correct scale. To do this, let's take for example a player with a win rate of 14BB/100. As we know from practice, the average sigma for most players is 100bb/100 (in poker trackers, this indicator is denoted by std.dev).

I have drawn in red on the same picture how the "bell" of the distribution will look for the given scales (expected value = 14 and sigma = 100).

In fact, this red line will lie even lower, i.e. will be almost smeared along the x-axis. The area under both lines (red and black) should be the same and equal to one. And for the red line, i.e. in the case of poker, the probability of getting close to 14BB/100 in 100 hands will be very small. We have a very high probability (~32%) that in 100 hands played, we will get the result from losing more than (-86BB) to winning more than 114BB. While for the black line, the measurement results will always be close to the value = 14.

This is a visual representation of the impact of how large the variance in poker is compared to other aspects of life.

-------------

But if we play for a very long time, then this red line will shrink and move away from the X axis, until, with a certain number of hands played, it becomes similar to a black line in scale. Later I will probably calculate what the approximate playing distance should be for this.
 
Poker_Mike

Poker_Mike

Legend
Loyaler
Joined
Aug 15, 2017
Total posts
5,071
Awards
2
Chips
403
Yup - it is a bell curve because it is a natural phenomenon.

Your talent and poker knowledge is what you can use to bend the curve to the winning side as much as possible.

Good post.
 
BelFish

BelFish

Legend
Loyaler
Joined
Aug 11, 2019
Total posts
2,396
Awards
3
BY
Chips
309
For a certain playing distance, the sigma is recalculated for the entire distance, and not for the minimum tracker step of 100 hands. To do this, the std.dev indicator from tracker must be multiplied by the root of the playing distance divided by 100:

Sigma(N) = (std.dev)*[(N/100)]^0.5

And the mathematical expectation for a playing distance of N hands is calculated as follows:

ME(N) = Winrate*N/100

The greater the playing distance N, the smaller the deviation in relative terms, because Sigma(N)/ME(N) ~ N^(-0.5)

And for N tends to infinity, this ratio tends to zero.

For the length case, we had this relationship:

Sigma/ME=2/14=1/7

And now let's determine what game distance must be played in poker so that this ratio is the same and the distribution graph for poker becomes similar to the distribution graph for length.

Sigma(N)/ME(N) = [(std.dev)*(N/100)^0.5]/[Winrate*N/100] = (10*std.dev)/({N^0.5}*Winrate ) = 1/7

(10*100)/({N^0.5}*14) = 1/7

N = [1000/2]^2 = 250000 hands!
 
BelFish

BelFish

Legend
Loyaler
Joined
Aug 11, 2019
Total posts
2,396
Awards
3
BY
Chips
309
I consider the ratio "Sigma/ME=1/7" to be optimal.

Perhaps optimal even 1/6

Then, according to the "3-sigma rule", according to which the deviation from the mathematical expectation with a probability of 99.7% does not exceed 3 sigma up and down, it turns out that the profit (win rate) with almost 100% probability will be no less than half of the mathematical expectation. And the graph for the "bell" of the distribution in this case will be tall and narrow as for real measurements in everyday life, and not flattened and smeared along the X axis, as it turns out for a short game distance in poker.

The number of hands equal to 250,000 hands obtained above just gives such a ratio for the proportions of the chart. But this is not generally for any player, but for whom, over a long playing distance, the win rate is kept around 14BB/100, and std.dev = 100BB/100. For other indicators, a different value of N will be obtained.

For example, if a player has a win rate of 7BB/100, then using the same formula as above, we get:

(10*100)/({N^0.5}*7) = 1/7

N = [1000]^2 = 1.000.000 hands! And that's 4 times longer playing distance than for a player with a 2 times higher win rate!

This is the distance (let's denote it N*) for a player with win rate=7BB/100 and std.dev=100BB/100, at which he is almost guaranteed to make a profit of at least half of the mathematical expectation.

For each player we will get a different value (N*) since win rates are different for everyone, and std.dev also has a spread from about 80BB/100 for very tight players to about 120BB/100 for loose-aggressive players.
 
blueskies

blueskies

Legend
Loyaler
Joined
Jan 31, 2009
Total posts
3,693
Awards
9
Chips
466
Yeah it's the variance, or luck, that drives me nuts. Gotta accept it as part of the game, but still it's a tough pill to swallow when it's running against you.

I've had 5 KKvs. AA AIPFs in the last week. Lost them all. I guess I should start playing KK more passively.

None AA vs. KK or any other AIPFs when I have gotten AA. In fact, only once did I even get to a flop when I had AA in the last week.
 
BelFish

BelFish

Legend
Loyaler
Joined
Aug 11, 2019
Total posts
2,396
Awards
3
BY
Chips
309
The expected payoff refers to a certain playing distance (N of hands). And it is determined not "in a vacuum", but with a given reliability and represents the interval within which this expected win will be. For example, if the reliability is 95%, then only 5% of the time the winnings will be outside this interval: 2.5% are the big lucky ones and 2.5% are the most unlucky ones.

These intervals depend on "Sigma" and N and are calculated for the selected confidence level (P) through such a function (if we are talking about Excel) as CONF.INT (P, Sigma, N)

CONF.INT - confidence interval

(P) you can choose any. For example, for a deviation of no more than one sigma, (P) = 68.2% (which can be seen in the figure below: 34.1% + 34.1%).


But it's usually good to choose (P) = 95%

And then the expected win with the selected reliability of 95% when playing the distance of N hands will be in the interval:

From [M.E. - CONF.INT(P, Sigma, N)] to [M.E + CONF.INT(P, Sigma, N)]

M.E. - mathematical expectation (expected value).

The upper part of the deviations on the probability distribution graph can be cut off, because this "tail" of the distribution describes the 2.5% of the largest winnings, which any player will only be happy about. Then we can say that with a probability of 97.5% at a distance of N hands, the expected winnings will be greater than [M.E. - CONF.INT(P, Sigma, N)]

A lot of useful information on such calculations and simulations can be found in this variance calculator:


-------------

Here is an example of calculating the expected win at a certain playing distance. For example, the player's win rate is +7BB/100 and std.dev is 90BB/100 and you want to estimate the interval for the expected win over 500K hands.

M.E.=7BB*500000/100 = 35000BB

Sigma = 90*(500000/100)^0.5 = 6365BB

3 Sigma ~19100BB

According to the "3 Sigma rule", 99.7% of all wins or losses will be within the interval (M.E. ± 3 Sigma)

This means that approximately 3 people out of 1000 will get a 19100BB deviation from their expected payoff (35000BB) over 500K hands. So the expected win is about 350 stacks of 100bb, and 1 or 2 people out of 1000 will win less than 150 stacks, and another 1 or 2 people out of 1000 will win more than 550 full stacks of 100bb over 500k hands.

2 Sigma ~ 12730BB

Or about 25 players out of 1000 (2.5%) with a win rate of 7BB/100 and std.dev = 90BB/100 will win less than 350-127=223 stacks, and about 25 people (also 2.5%) will win more than 350+127=477 full stacks of 100bb over 500K hands.

 
Last edited:
A

a1232

Rock Star
Bronze Level
Joined
Nov 22, 2022
Total posts
306
Awards
1
IE
Chips
37
Yeah it's the variance, or luck, that drives me nuts. Gotta accept it as part of the game, but still it's a tough pill to swallow when it's running against you.

I've had 5 KKvs. AA AIPFs in the last week. Lost them all. I guess I should start playing KK more passively.

None AA vs. KK or any other AIPFs when I have gotten AA. In fact, only once did I even get to a flop when I had AA in the last week.
But if you play enough at a consistent stake, surely this isn't enough to do any damage? I.e. you will have just as much positive streaks etc. This is assuming we can keep level headed and play in a consistently optimal way without tilt etc.
 
rastapapolos

rastapapolos

Rock Star
Bronze Level
Joined
Sep 21, 2013
Total posts
441
Awards
2
DZ
Chips
65
That's why the pros likes to put in the big numbers. They need a lot of data to have a close insights about their own game and to adapt accordingly. As long as you get enough data over time, you'll notice a regression to the mean, the two extreme 2.5% will not stay there forever, the big lucky and the most unlucky if they play enough hands over time they will regress to the mean of the bell curve if we don't consider other factors other than luck.
 
dreamer13

dreamer13

Legend
Platinum Level
Joined
Mar 18, 2022
Total posts
3,723
Awards
2
LV
Chips
832
You may not work with poker calculators, you may not understand anything about hand ranges, but it is stupid to deny the basics of poker mathematics. Dispersion is one of the fundamental concepts in game theory. Variance is good luck or bad luck in terms of mathematics. By calculating the variance, you can really see the impact of luck in a particular discipline. If 15% of the time you are not destined to win with AA, then you are bound to be in this selection. These are the rules of the game. The first rule of a successful poker player is to observe bankroll management. If you can't handle variance, avoid it.
 
BelFish

BelFish

Legend
Loyaler
Joined
Aug 11, 2019
Total posts
2,396
Awards
3
BY
Chips
309
By the way, i remembered Pearson and his coin. He tossed a coin 24000 times to check the frequency of dropping :D

In fact, in poker is about the same here. Talking about game distance...

I remember at university we solved a problem with the following condition: how many times you need to toss an "fair" coin so that the frequency of tails deviates by no more than 1% from the true value (1/2) with 99% reliability.

You will have to throw it many times ))

But it is very easy to calculate this using the table below, exactly the same method as i calculated for poker.


So, the problem for poker that i solved above, with the condition that the winnings are almost guaranteed to be from 0.5*M.E. to 1.5*M.E., is exactly the same problem as for a coin. It can be reformulated as follows: how many hands must be played so that the value of the winnings deviates from the M.E. by no more than 50% with a certainty of 99.95% (this is exactly the accuracy that comes out for a deviation of ±3.5 Sigma).

And this task is given by so boundary condition:

3.5*Sigma = M.E./2

It is possible to take less reliability for poker, - 99% as for the problem with a coin (or even 95% in general), but to look for the playing distance at which the winning amount will deviate from the M.E. by no more than, for example, by 5% -10% or generally by 1%, as in the problem with the coin ))

This playing distance will be simply huge (for a deviation of no more than ± 1%) - you have to live 300 years and grind a bunch of tables every day to reach :p

At the same time, although on the general profit chart in tracker the yellow and green lines will practically merge into one line, but in absolute terms there may be shortfalls of thousands and even tens of thousands of stacks. You just can't to see this deviation on the chart for so big playing distance.
 
Rockyfour

Rockyfour

Visionary
Silver Level
Joined
Apr 3, 2021
Total posts
547
Chips
15
Threads like this make me nervous because it appears people are smarter than me and are convinced that I should hit some bad variance and that I am just getting lucky.

I have hit bad variance, but I'm also up thousands of buy-ins over the last 5 years.

Still plants the seed in my head though, 'maybe I'm just getting lucky'.
 
BelFish

BelFish

Legend
Loyaler
Joined
Aug 11, 2019
Total posts
2,396
Awards
3
BY
Chips
309
Tomorrow i will make calculations for playing distances, at which the percentage deviations from the expectation will be such that on the chart it will be impossible to distinguish the green profit line from the yellow EV line in the tracker.

I’ll also show you how to count quite interesting things using the Laplace function value table. There will be 2 tasks:

1.) What is the probability of playing a session without a loss (profit from $0 and above).

2.) What is the percentage of gaming sessions in which the selected "stop loss" will be reached.
 
BelFish

BelFish

Legend
Loyaler
Joined
Aug 11, 2019
Total posts
2,396
Awards
3
BY
Chips
309
For reliability of 95%, it can and will turn out to be a distance that a person can play, if we consider for a deviation from M.E no more than ± 5%

The boundary condition for such a problem is the following:

2*Sigma = MO/20

It turns out that you need to play such a distance at a certain win rate and std.dev, so that Sigma becomes 40 times less than M.E.

In general, for a win rate of 14BB/100 with std.dev 100BB/100, so that with a certainty of 95% the deviation of profit from M.E. it turned out no more than 5%, it is necessary that the equation be fulfilled:

(10*100)/({N^0.5}*14) = 1/40

Then we get for the playing distance:

N = [1000/0.35]^2 = 8.160.000 hands.

Similarly for the 7BB/100 win rate. The distance is 4 times greater.

(10*100)/({N^0.5}*7) = 1/40

N = [1000/0.175]^2 = 32.650.000 hands.

--------------------

So that with a certainty of 99% the deviation from M.E. came out no more than 1%, the following equation must be satisfied:

2.58*Sigma = MO/100

Then we get for a win rate of 14BB/100:

(10*100)/({N^0.5}*14) = 1/258

Playing distance: N = 339.600.000 hands.

And for a win rate of 7BB/100:

(10*100)/({N^0.5}*7) = 1/258

Playing distance: N = 1.358.400.000 hands.

PS. If you play tighter and still have the same win rates, then std.dev can drop to 80-90BB/100, which will reduce the numbers for distances obtained above.

For example, for std.dev=80, distances will be 28.44% fewer hands.
 
BelFish

BelFish

Legend
Loyaler
Joined
Aug 11, 2019
Total posts
2,396
Awards
3
BY
Chips
309
For a win rate of around 20BB/100 and std.dev ~ 90BB/100, the playing distance for the last example would be somewhere in the region of 100 million hands.

For example, if Megabarsuk finishes his distance at the NL2 limit to 100 million hands, then his chart will visually look like with no shortfall:


PS. In fact, visually, it will look without shortfall much earlier, because the divergent of the lines on 2%-3% on the chart will most likely be indistinguishable. So 30 million hands will suffice. There are not so many hands left to play to even out the schedule, making it perfect )))

P. S.2. Tomorrow i'll show you how to solve the other 2 tasks about which i wrote above.
 
Last edited:
heguli82

heguli82

Rock Star
Bronze Level
Joined
Jul 1, 2020
Total posts
445
Awards
2
FI
Chips
143
Great posts, its always a pleasure read or listen people who are wiser then you are.
 
BelFish

BelFish

Legend
Loyaler
Joined
Aug 11, 2019
Total posts
2,396
Awards
3
BY
Chips
309
You can also, for example, calculate the probability of losing 3 stacks in N hands (a conditional value for a stop loss).

Or the probability that for N hands we will play with a profit (winning from $0 and more).

For N hands, the expected payoff will be:

W(N) = (N/100)*M.E.

To play a session of N hands with a positive profit, the following inequality must be satisfied:

W(N) - (N/100)*CONFIDENCE(P, Sigma, N) > 0

(N/100)*M.E. - [(N/100)^0.5]*Sigma*x > 0

x = [(N/100)^0.5]*M.E./Sigma

Here is a table of values of the Laplace function from which the integral probabilities can be determined by this coefficient (x):


For example, a session is only 100 hands long. Then x = M.E./Sigma

Let M.E.=5BB/100, Sigma=100BB/100, then x=0.05

We find in the table for x=0.05 the value of the Laplace function F(x) = 0.01994
The probability (for 100 hands) to play with a profit greater than zero is equal to:

Р =1 - {1 - 2*Ф(х)}/2

P = 1 - {1 - 2*0.01994}/2 ~ 52%

If we take a session of N = 2000 hands, then x = [(2000/100)^0.5]*M. E. /Sigma = 4.47*5/100 = 0.2235

Then Ф(х) ~ 0.088

Р = 1 - (1 - 2*0.088)/2 = 0.588 ~ 59%

Those, for a given win rate and variance, the guarantee that in a session of 2000 hands we will play no worse than zero profit will be only 59%!!!

You can find such a number of hands in which the guarantee will be 90%:

P={1-2Ф(х)}/2=0.1
F(x)=0.4
Then from the table we get x=1.28

x = [(N/100)^0.5]*M.E./Sigma = 1.28

N = 100*(1.28*100/5)^2 ~ 65.500 hands.

This means that out of 1000 players with a win rate of 5BB/100, over a distance of ~66K hands, 100 people will play in the minus, and 900 in the plus.

---------------

To lose 3 stacks, we get the equation:

(N/100)*M.E. - [(N/100)^0.5]*Sigma*(x) = -300

You can find what will be equal to (x) for any length of the game session (N hands). And by this value (x) from the Laplace table, we will find the probability of reaching this stop loss (3 stacks). This will be the frequency of forced ending of game sessions.

For a very short gaming session N=100 hands:

M.E. - x*Sigma + 300 = 0
5 - x*100 +300 = 0
x=3.05

Ф(3.05)=0.49886

P=(1-2*0.49886)/2=0.00114 ~ 0.11%

We see that in such a short game session it is almost impossible to lose 3 stacks with a win rate of 5BB/100

Now for session N=2000 hands:

(2000/100)*M.E. - [(2000/100)^0.5]*Sigma*x = -300

20*5-4.47*100*x = - 300
x=400/447=0.895
Then Ф(х) = 0.314

Probability of losing 3 stacks or more:
P=(1-2*0.314)/2=0.186 or ~ 19%

That is, it comes out with a win rate of 5BB/100, if you play all sessions of about 2000 hands, then every fifth session will be forcibly stopped (with clear stop-losses of 3 stacks, if a person is disciplined, and does not try to win back).
 
puzzlefish

puzzlefish

Legend
Loyaler
Joined
Feb 18, 2018
Total posts
4,770
Awards
3
CA
Chips
854
This is making me want to play poker less and less. Especially after today. Thank-you BelFish for encouraging me to spend more time with my family.
 
Rockyfour

Rockyfour

Visionary
Silver Level
Joined
Apr 3, 2021
Total posts
547
Chips
15
This is making me want to play poker less and less. Especially after today. Thank-you BelFish for encouraging me to spend more time with my family.
Just remember the chosen standard deviation isn't actually the deviation so the variance could be much less. This is just an approximation.

For example if I'm playing 20% VPIP and everyone else is playing 75% VPIP there is going to be a significant edge towards me just in preflop equities, and over even a small sample size of like 10k hands it becomes a bit tough for the 75% VPIP player to out-luck you if that makes sense.

Like imagine playing 10k of hands of black jack at the casino and somehow coming out of head. Possible, but not very likely.
 
L

legend309

Rock Star
Bronze Level
Joined
Jul 16, 2022
Total posts
182
Awards
1
CA
Chips
25
Yup, a little over my head lol
 
BelFish

BelFish

Legend
Loyaler
Joined
Aug 11, 2019
Total posts
2,396
Awards
3
BY
Chips
309
Just remember the chosen standard deviation isn't actually the deviation so the variance could be much less. This is just an approximation.
True, but everyone can estimate their variance by the std.dev indicator from the tracker. Then you will need to substitute your winrate and variance values into the same formulas.

For example, if you often use the "all-in cashout" option at pokerstars, then std.dev can generally turn out to be about 70-75BB/100
 
lukaszkrzi

lukaszkrzi

Rock Star
Silver Level
Joined
Apr 6, 2015
Total posts
331
Awards
1
Chips
4
You are correct that winnings in poker are often described by a normal distribution, also known as a Gaussian distribution or a "bell curve." The standard deviation, or sigma, is a measure of the spread of the data around the mean or expected value. In poker, a player's win rate is often measured in big blinds per 100 hands (BB/100) and the standard deviation of winnings is also often measured in BB/100.

You have also correctly explained that when the standard deviation is large, such as in poker, the distribution will be more spread out and the probability of getting close to the expected value in a small number of hands will be small. However, as you mentioned, as the number of hands played increases, the distribution will shrink and move closer to the expected value. The specific number of hands needed for this to happen will depend on the player's win rate and standard deviation.

It's worth to mention that this is a simplification of the reality, this is only the case if the player is a long term winner and his win rate is stable over time, otherwise the results will be different and could be affected by many other factors.
 
BelFish

BelFish

Legend
Loyaler
Joined
Aug 11, 2019
Total posts
2,396
Awards
3
BY
Chips
309
Knowing your win rate and std.dev over a long playing distance (from the tracker), you can absolutely determine what bankroll is required in order to have a certain risk of ruin, which everyone chooses for himself. For example, it is good to choose the risk of ruin R=5%, otherwise it will be an overly conservative game. But if poker is your profession, then it is better to choose the risk of ruin no more than 1%-2%

The formula that is used in the primedope calculator is completely accurate and works for any type of game:

BR = {D/2m}*Ln(1/R)

D - dispersion (variance)
m - win rate
R - risk of ruin

D=[std.dev]^2

If R is chosen equal to 2%, then Ln(1/R)=Ln(1/0.02)=Ln(50)=3.912

For example, your indicators in the tracker are: m=7BB/100, std.dev=90BB/100

Then BR= {(90^2)/(2*7)}*3.912=2263.4BB or about 23 stacks of 100BB each. It is with this BRM for a player with a win rate of 7BB/100 and std.dev = 90BB/100, the risk of ruin will be equal to 2%

And if we consider a player with indicators m=2BB/100, std.dev=100BB/100, then in order for him to have a ruin risk of no more than 2%, a much larger bankroll will be required:

BR= {(100^2)/(2*2)}*3.912=9780bb or almost 100 full stacks of 100bb each.

P.S. Everyone can personally calculate the right BRM for themselves!
 
Rockyfour

Rockyfour

Visionary
Silver Level
Joined
Apr 3, 2021
Total posts
547
Chips
15
Knowing your win rate and std.dev over a long playing distance (from the tracker), you can absolutely determine what bankroll is required in order to have a certain risk of ruin, which everyone chooses for himself. For example, it is good to choose the risk of ruin R=5%, otherwise it will be an overly conservative game. But if poker is your profession, then it is better to choose the risk of ruin no more than 1%-2%
What is your profession master Belfish?
 
BelFish

BelFish

Legend
Loyaler
Joined
Aug 11, 2019
Total posts
2,396
Awards
3
BY
Chips
309
What is your profession master Belfish?

Player )))

For probably more than 10 years i have been earning money mainly by playing different games...

And by education i'am a physicist :)

----------------

P.S. By the way, here is how the formula for the risk of ruin is derived:

 
Last edited:
Rockyfour

Rockyfour

Visionary
Silver Level
Joined
Apr 3, 2021
Total posts
547
Chips
15
I ran oer 30 buyins under last nit and I smased my keyboard by accident and now cant type properly :(
 
Top