I began my research for my book Tournament Poker for the Rest of Us with a single driving question: what is the best style for playing tournament poker? I had been playing “Harrington” style poker for years, a style based on the Harrington on Hold’em series of tournament poker books. This is basically a tight and aggressive style when our stacks are at least moderately deep. Then it transitions to a “shove-fold” style once our stacks falls below 10 BBs or so.

But I wondered if the “chip-up or go home” style wouldn’t provide better results. Rational arguments can be made for either style, and we can find tournament champions at either extreme. So which is better?
“The more I practice, the luckier I get.” Arnold Palmer
Cash Game Variance
My previous article was entirely about cash game variance. We can easily track our cash game results to determine our win rate and variance, which establishes the quality of our cash game play. For example, Mr. Liberty had a win rate of 4.2 ± 2.2 BB/100 over 100,000 hands, so he is clearly a quality player.
Cash game variance is a function of how “active” we are; the more hands we play and the more aggressively we play them, the higher our variance will be. But our cash game variance has little to do with our cash game success.
Tournament Variance
Estimating variance is much trickier for a tournament player. We can’t simply calculate how many chips we win since their “value” varies during the tournament. Not only do the blinds and antes escalate, our chips have no intrinsic cash value until we bust out. In fact, every tournament player except the winner eventually loses all of his chips.
Instead, the usual method for judging tournament success is to calculate our Return on Investment (ROI). This is simply (our total profit) / (our total investment), expressed as a percentage. We can quibble about what each term actually means, but a player is a winner when his ROI is greater than zero.
We could also record our tournament finishes and calculate our average place and a standard deviation, but there are difficulties with this approach. 1) Data points take a long time to accumulate. 2) Every tourney has a different structure, buy-in, number of entrants and so forth. This makes analysis mathematically dubious, somewhat like combining $1/$2, $1/$3, $2/$5 and $5/$10 cash game results into a single profit number.
Mr. TAG’s Tournament Bell Curve
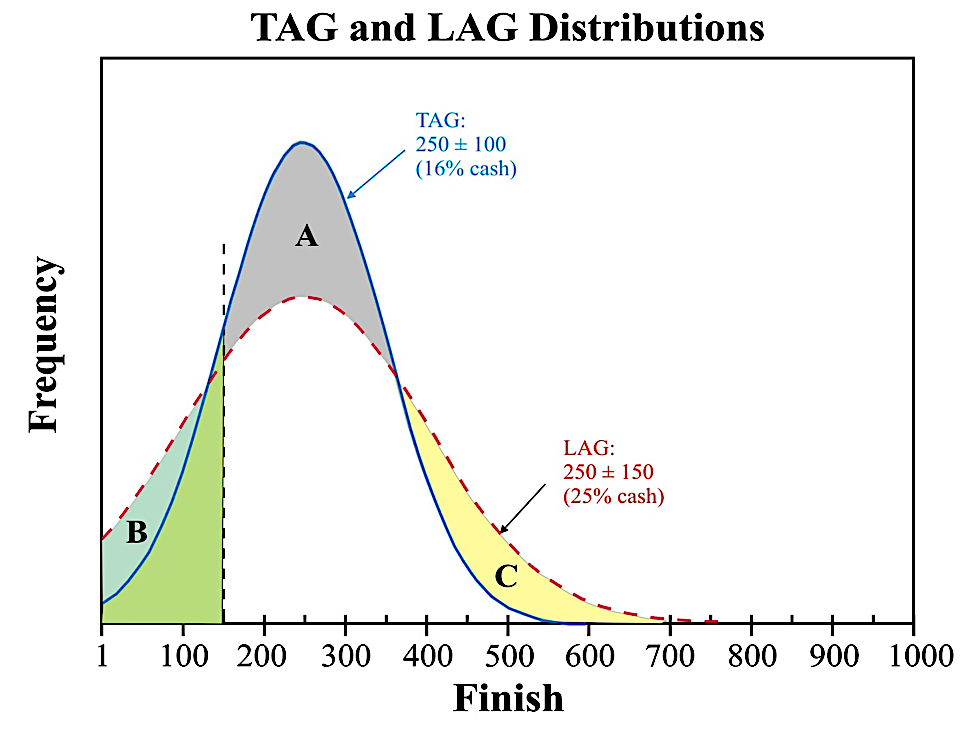
We can’t be certain what a tournament performance curve looks like, but we can make an educated guess. Suppose Mr. TAG is an excellent tournament player who has played a large number of identical 1,000-player tournaments. His results might then follow the tournament bell curve depicted in Figure 1. (Don’t laugh. The actual distribution from my online Sit-N-Go tournaments shows just such a bell curve shape.)

Mr. TAG averages 250th place, with a standard deviation of 100 places and he cashes 16% of the time (the green area under the TAG curve). If Mr. TAG simply chops the prize pool with the other cashers, his ROI would be only about +6%. (In reality he does better than this since the prize pool is top heavy and he will sometimes cash “deep”.)
Mr. LAG’s Tournament Bell Curve
Mr. TAG thinks his ROI isn’t as good as it should be. After all, he is a very good player. But there are only two ways to increase his ROI:
- He can improve his game, which has the effect of shifting his bell curve to the left. Playing better poker is a complex enterprise, but it’s the solution most of us strive for. That’s why we read books and strategy articles.
- We can widen our bell curve by increasing our variance.
So Mr. TAG adjusts his tournament style in such a way as to increase his variance without shifting his average finishing place, the LAG curve of Figure 1. We can see that Mr. LAG has increased his variance by 50%, which redistributes some of his results from region A to regions B and C of his bell curve.
This increases his ROI for one simple reason: it doesn’t matter where he finishes if he doesn’t cash. Finishing 900th place is no worse than finishing 200th, so moving even a small number of finishes from region A to region C will improve his ROI.
Mr. LAG now cashes about 25% of the time, and he would have a 67% ROI if all cashers simply chop the prize pool equally. But it’s even better than that. Widening his bell curve also results in a higher frequency of “deep” cashes, which means his actual ROI should be much better than Mr. TAG.
Even though these curves are only hypothetical, Mr. LAG’s strategy is valid even if his initial bell curve is different from the TAG curve. Mr. LAG has redistributed some of his medium finishes (region A), and moved them to the tails of the LAG curve (region B and region C), increasing both his high and low finishes. He either chips-up or goes home early.
This doesn’t mean we can play like a maniac. That strategy certainly widens our bell curve, but it shifts the peak significantly to the right. What we are attempting to do is to polarize our finishes, to create a “flatter” and “wider” statistical distribution by increasing our variance without significantly degrading our average finish. That requires an intelligent LAG strategy rather than a wild maniac strategy.
Conclusion
I have answered my original question. A tournament LAG strategy can be thought of as a “chip-up or go home” strategy, which can be superior to a tight Harrington strategy. Our goal should be to take reasonable risks, even some with a slightly negative chip-EV. Taking those risks widens our bell curve and results in higher tournament finishes when they pay off.
Steve Selbrede is the author of six poker strategy books: The Statistics of Poker, Beat the Donks, Donkey Poker Volume 1: Preflop, Donkey Poker Volume 2: Postflop, Donkey Poker Volume 3: Hand Reading and Tournament Poker for the Rest of Us.


