A previous version of this article created a bubble time algorithm based on WSOP tourneys with 60 minute levels. But that algorithm did not accurately predict the bubble time for tourneys with shorter level times. This version includes an analysis of tourneys with 30 and 40 minute levels times, which significantly improves the accuracy of the bubble time prediction.

Last week, I presented my “Cash First – Win Later” tournament philosophy. I showed a graph that makes it clear that our finishing place is only weakly correlated to how many chips we cash with.
I also showed how a large number of players blew their bubble even though they had plenty of chips to achieve a guaranteed cash. And this included only those players I was able to track. I have little doubt that many additional players unnecessarily busted just before the Day 2 tracking began.
This might be the result of a “go for broke” mentality, which is not uncommon in tournament poker. Some players believe that they should take big risks to try to win the tournament. But blown bubbles could also be the result of lack of awareness about their bubble situation.
If we wish to play well near the bubble, it’s important to know when it will burst.
“Nine-tenths of wisdom consists of being wise in time.”
– Theodore Roosevelt
In the 2018 WSOP Senior event, for example, I folded pocket jacks on the last hand of Day 1 specifically because I knew that the bubble would burst about 15 hands into Day 2. If I had been unaware of that fact, I may well have shoved my jacks and busted out. Yet even a successful shove would not have appreciably improved my chances to win the tournament.
I knew when the bubble would burst last year because I studied the 2017 event and could see that the 2018 event was proceeding at the same rate. But predicting the bubble for 2019 WSOP events will be trickier since the new structures are dramatically different. So we need a more general method to predict when a bubble will burst.
Bubble History
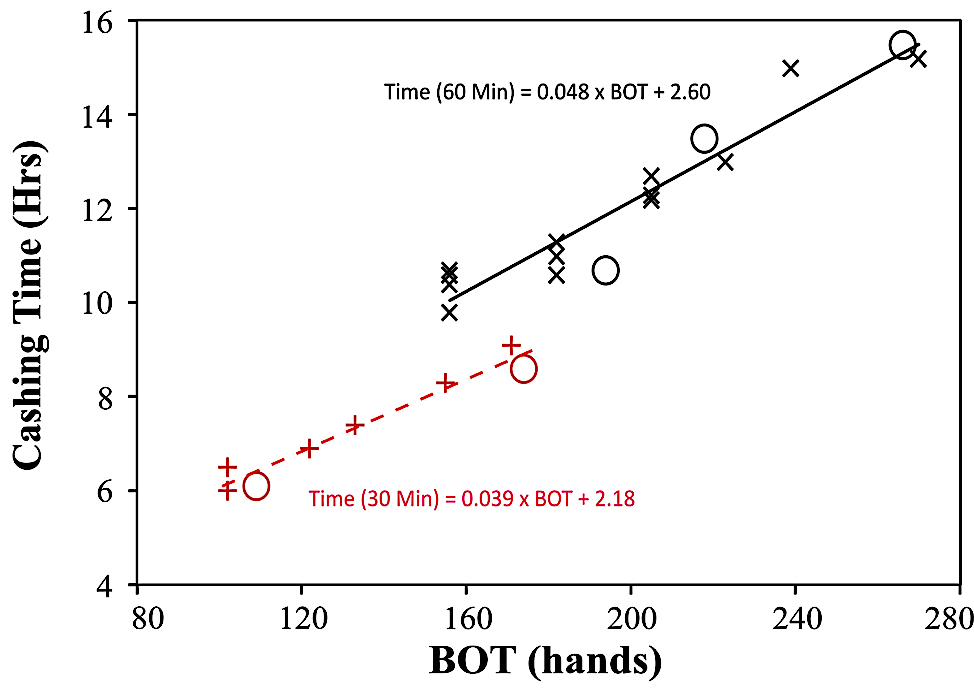
I studied the WSOP reporting for twenty five 2018 WSOP No-limit Hold’em events and tabulated the number of playing hours it took to cash, converting this to the number of played hands by assuming a dealing rate of 30 hands per hour. I also calculated the Blind Off Time (BOT) for each tourney, assuming the same dealing rate. Figure 1 shows a plot of the Cashing Time (hands) vs. BOT for these tourneys.
Cashing Time vs. Blind-Off Time

The top curve (solid line) shows the trend for tourneys with 60 minute levels and the bottom curve (dashed line) shows the trend for tourneys with 30 minute levels. There is a very strong correlation between Cashing Time and BOT for each curve. Even the Big Blind Ante (BBA) tourneys showed the same relationship (circles), which is important since the 2019 WSOP uses a BBA structure for all NLH events. So we can conclude that:
CASHING TIME (60 min levels) = 0.048 × BOT + 2.6
CASHING TIME (30 min levels) = 0.039 × BOT + 2.2
We can extrapolate between these curves to estimate the Cashing Time for tournaments with 40 or 50 minute levels.
Estimating Bubble Time at the 2019 WSOP
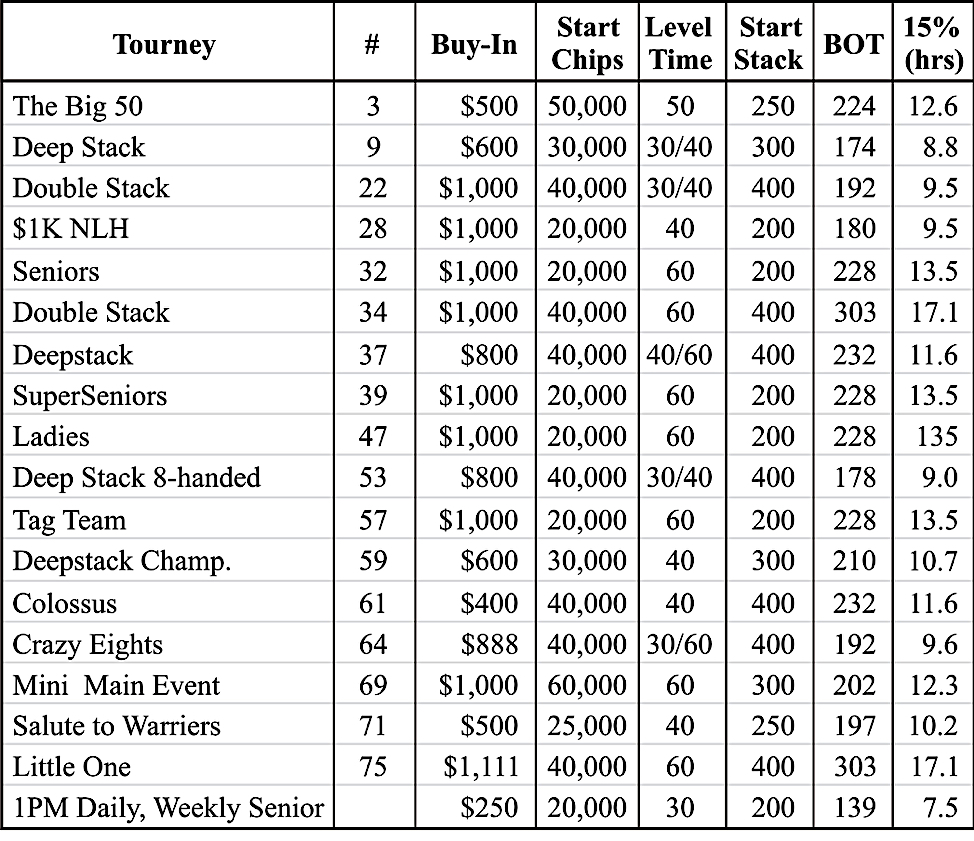
We can apply this to some of the lower cost 2019 WSOP events, summarized in Figure 2.

The “15%” column estimates the playing time to the bubble, since the WSOP pays the top 15% of the field. For example, the Colossus (Event #61) should bubble at about 13.9 hours of play, which is about 3.9 hours into Day 2. The Mini Main Event should bubble in about 12.1 hours. Events number 9 and 28 are the only ones where the bubble might burst during Day 1, especially if they extend the time a bit to make that happen.
Checking Our Prediction
Inevitably, there is some uncertainty in these predictions, so we can’t trust them completely. But we can verify our bubble estimate based on how long it takes to whittle the field down to 20%.
I studied the percentage of remaining players vs. the number of hours played for several 2018 WSOP events and found that the curves always had similar logarithmic curves. In fact, we can easily estimate the time it takes to reduce the field from 20% to 15% as:
Additional Time (Hours) = 5 × ln(20/15) = 1.44 hours
Applying this knowledge to the 2019 Colossus we expect it to reach the bubble in 11.6 hours, with the 20% mark just 1.44 hours earlier, at 10.1 hours. This is interesting and useful since the 20% mark should occur near the end of the Day 1 play. If we make Day 2, we can simply estimate the bubble time based on the number of players who actually made Day 2.
So, for example, if 20.5% of the Day 1 players made Day 2, we can expect the bubble to occur about 5xln(20.5/15) = 1.6 hours into Day 2.
So our plan for the Colossus is simple. We play as well as we can to reach Day 2, expecting to play another 1.6 hours to reach the bubble (2.5 levels). We simply adjust our estimate based on how many players actually make it to Day 2. If the 25% mark takes longer than predicted, we should expect the bubble to take longer. If it occurs more quickly, the bubble will occur earlier than predicted. This method is very easy to apply to any tourney that cashes during Day 2.
I should also note that, at the time of this writing, both events #3 and #9 came very close to the values predicted here.
Stack Size Categories
Our near-bubble stack size can be put into three general categories: healthy, sufficient and short. We have a “healthy” stack when we can play normally without risking our cash. Suppose we need a 10 BB stack to fold-to-cash. Then we can aggressively wield our 40 BB stack against smaller stacks, with relatively little risk. The key is to not risk more chips than we can afford to lose; we should not be shoving into larger stacks, even with aces. When our aggression fails, our stack merely decreases a bit. When it succeeds, we survive the bubble with an even healthier stack. We should be active when we have a healthy stack.
We have a “sufficient” stack when we can confidently fold-to-cash. If we need a 10 BB stack to cash, then our 15 BB stack would be sufficient. Folding to a guaranteed cash nearly always has better Dollar-EV than playing normally. We should be inactive when we have a “sufficient” stack, not risking our cash.
We have a “short” stack when we cannot fold-to-cash. Suppose we need 30 BBs to cash, but we only have 25. We then must take some chances to increase our stack, or at least maintain it. So perhaps we make a GTO shove or two in the right situations. Or perhaps we simply play a few hands of strong poker.
Conclusion
It is crucial to know when the bubble will burst so that we can adjust our near-bubble play with optimal control. Blowing a guaranteed cash should be considered a cardinal sin in poker.
Steve Selbrede is the author of six poker strategy books: The Statistics of Poker, Beat the Donks, Donkey Poker Volume 1: Preflop, Donkey Poker Volume 2: Postflop, Donkey Poker Volume 3: Hand Reading and Tournament Poker for the Rest of Us.


